From the PARcore Data Visualization Studio Landing Page, navigate to this report by selecting the DIF Analysis Statistics report icon. This report is only applicable for requests that include the Analysis Type of Item Analysis - Differential Item Functioning.
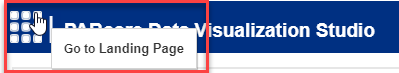
The bento box menu icon at the top left of the report can be used to navigate back to the Landing Page.
When first launching the report it will be empty. Make initial filter selections in order to visualize the report. Any filter with a red asterisk indicates it is required to have a selection made before the report can be displayed.
Filters
Refer to Visualize Results for general information about filter navigation for any report. The filters for this report are:

- Analysis - select one analysis sequence number to view at a time. The analysis sequence number will reflect the sequencing from Request Details for this request.
- Upon first initializing this dashboard, the filter will display as (Choose your analysis) and a selection must be made.
- Select the search icon (magnifying glass) and enter search text to see Analysis filter options for the request you are viewing. Using an asterisk in the search text box will display all possible analyses to choose from.
- Once the current analysis results have been reviewed, continue to use the search feature or utilize the slider arrows (< and >) to view each analysis one at a time. If you only have one analysis to view, the slider arrows will be disabled.
- The filter description will include the criterion score being analyzed as well as the reference and focal group. Only one reference/focal group comparison will be displayed at a time.
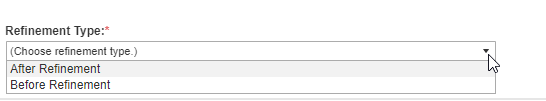
- Refinement Type - select one refinement to view at a time.
- Upon first initializing this dashboard, the filter will display as (Choose refinement type.) and a selection must be made before any data is visualized. Use the dropdown filter to display the possible refinements stored for this comparison group.
- The available refinement type(s) to choose from depend upon the user selected options for this analysis as well as the analysis results. The available options are:
- No Refinement: This will appear if the user selected "No" to the analysis template option to Refine Criterion Score. This will be the only refinement option available.
- None Required: This will appear if the user selected "Yes" to the analysis template option to Refine Criterion Score but the comparison analysis resulted in no C items and therefore no refinement was performed. This will be the only refinement option available.
- Before Refinement: This will be available if the user selected "Yes" to the analysis template option to Refine Criterion Score and the comparison analysis resulted in at least one C item. The dropdown menu should show both "Before Refinement" and "After Refinement" as options. Selecting Before Refinement will display the frequency distributions and summary statistics before refinement was performed.
- After Refinement: This will be available if the user selected "Yes" to the analysis template option to Refine Criterion Score and the comparison analysis resulted in at least one C item. The dropdown menu should show both "Before Refinement" and "After Refinement" as options. Selecting After Refinement will display the frequency distributions and summary statistics after criterion refinement was performed.
- Item Scoring: Users can select which set of items to view based on the item scoring (dichotomous and/or polytomous).
- Since dichotomous items and polytomous items display a different set of statistics, users will need to view one set of statistics at a time if both dichotomous and polytomous items are included in the analysis.
- The default selection is "Dichotomous". If the comparison being viewed contains only polytomous items the filter selection will need to be updated before the table can be rendered.
- DIF Flag: This is a multi-select filter and allows users to select which items to display based on which flag(s) the item has.
- Upon first initializing this dashboard, the filter will display as (None) but should become populated once an Analysis filter selection is made.
- Default filter selection: any B (B+, B-) and/or C (C+, C-) items are selected by default.
- If this analysis and item scoring does not contain any B or C items a message will appear to indicate that there are no B or C flags. If desired, change the filter selection to view all items or proceed to your next review if you do not need to review items without flags.
- Only flags that are present in the data for the analysis/comparison and item scoring selected in the previous filters will be included in the dropdown menu.
- Selecting the blank entry will show items with no flags (A flags).
- Possible flags that could be presented:
- (All)
- <blank value> indicates an item with an A flag or no flag could be calculated
- B-
- B+
- C-
- C+
Example of no B or C flag message:

- Use Code: Users can select to filter the results to view only specific use codes if they desire.
- Default filter selection: (All)
- This is a multi-select filter.
- The dropdown list is in alphabetical order and only includes use codes that are relevant for the items in the selected analysis and item scoring and DIF flags selected.
- If an item has multiple use codes, which could happen if multiple assembly units are combined together, the filter will also include all observed combinations of use codes. For instance, selecting "E O" will display only items where some assembly units had an "E" and some had an "O" for the same accession number.
- The filter is displayed in alphabetical order of the use code, which may not match the order the multiple use codes appear in the table view. Therefore, an item with "O" and "E" or an item with "E" and "O" will both be included in the "E O" selection.
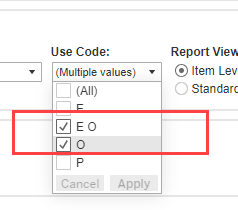
Example: Filtering to show only Operational "O" items. In this case you need to select both "O" codes and "E O" codes to truly see all items that are Operational.
The "O" will be items where all assembly units in that item are "O". The "E O" are items where some assembly units are "E" and some are "O".
- Report View: Users can select to which report table to display.
- Radio button options:
- Item Level - selected by default
- Standardized Percents
- Radio button options:
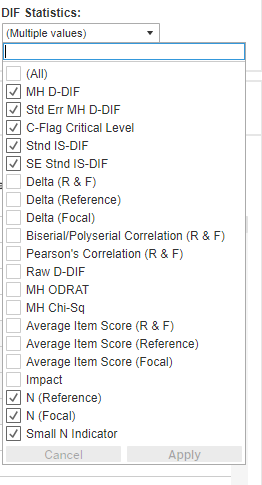
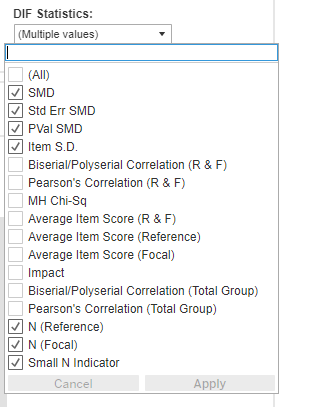
- DIF Statistics: Users can select which DIF statistics to display in the report table.
- A selection of relevant DIF statistics is already selected by default depending upon the report view.
- In order to view more or fewer statistics in the displayed table, adjust the filter selections and select APPLY. Click out of the filter menu to close it.
- The selection of DIF statistics differs between dichotomous items and polytomous items and also differs between Item Level report and Standardized Percents report.
- Only statistics stored for the comparison being viewed are available in the filter menu. Your given request may not contain every statistic displayed in the screenshots below if some were not calculated.
- A selection of relevant DIF statistics is already selected by default depending upon the report view.
Item Level report:
Example of dichotomous default selections Example of polytomous default selections
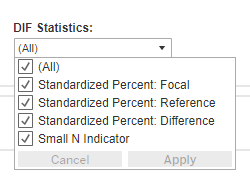
Standardized Percents report:
Example of default selections
Item Level Statistics Table
- The table will display all the relevant DIF statistics for each item based on your filter selections. The columns of statistics that appear are based on the selections made in the DIF Statistics filter.
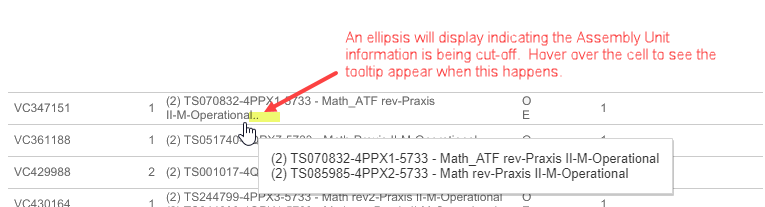
- The assembly unit information is a concatenation of the sequence, assembly unit ID, assembly unit name, test measure, test measure type, and research usage type for that item. The sequence is the number within parentheses at the beginning of the string.
- An ellipsis will display at the end of the assembly unit information if it was truncated due to length. When truncation occurs, a tooltip can be seen when hovering over the assembly unit information to display the full label without truncation
- If the analysis being viewed has multiple assembly units for a single accession number and the processing option of "Combine Responses by Accession # Across Forms/AUs" was selected in the request details, then the items are sorted based on the first assembly unit for that item. All other sequences and assembly units for that accession number, as well as each assembly unit's item use code are displayed.
Example of the Assembly Unit Information tooltip.
- When viewing an analysis that had refinement, a footnote at the bottom of the report will be included when viewing the refinement (Before or After) that is being stored to external services based on the "Statistics to use for external services" selection made by the user in the analysis template used for this request.
Example of the external service storage footnote:

- Insufficient volume indicator:
- If one or more items had insufficient volume to produce DIF statistics based on the user-selected comparison group requirements in Request Details, an additional column "Small N Indicator" will be available in the DIF Statistics filter. The item(s) with insufficient counts will have the value "[Small N]" populated in that field. This field is useful for understanding why statistics were not calculated for a given item.
- If the "determined by" option in Request Details is "Total Group N": every item will have the Small N Indicator flag when volumes were not sufficient to produce DIF for the selected analysis.
- If the "determined by" option in Request Details is "Item": only the specific items with insufficient counts will have this indicator and all other items will have the relevant DIF statistics calculated.
- If all items met the volume requirements the "Small N Indicator" column will not be included in the DIF Statistics filter options. It is only present when it is applicable.
- For comparisons that include at least one item with insufficient volume for DIF:
- A footnote will display at the bottom of the report and indicates how many items had insufficient volume to produce statistics. This count of items includes only polytomous items or only dichotomous items, depending on which Item Scoring selection is being viewed.
- Items where both the Reference Group N and Focal Group N are 0 will not be displayed or counted within the footnote calculation.
- In order to see the Small N Indicator column and know which items have Small N, the DIF Flags filter selection must be set to "(All)". Change your filter selection if needed.
- For Small N items, most statistics will be blank because they could not be calculated. A few statistics (N, average item score, delta, correlation) may be available if they were able to be calculated.
- While in the Item Level report view, if you would like to see only the items with Small N, change the DIF Flags filter to "(All)" and the DIF Statistics filter selection to only select "Small N Indicator". Click Apply.
- While in the Item Level report view, if you would like to see all items except those with Small N, update the DIF Statistics selection and deselect "Small N Indicator", "Reference N" and "Focal N", as well as any Average Item Score, Delta, or Correlation if they are currently selected. Click Apply.
- A footnote will display at the bottom of the report and indicates how many items had insufficient volume to produce statistics. This count of items includes only polytomous items or only dichotomous items, depending on which Item Scoring selection is being viewed.
- If one or more items had insufficient volume to produce DIF statistics based on the user-selected comparison group requirements in Request Details, an additional column "Small N Indicator" will be available in the DIF Statistics filter. The item(s) with insufficient counts will have the value "[Small N]" populated in that field. This field is useful for understanding why statistics were not calculated for a given item.
Example of the insufficient volume footnote for dichotomous items:

Example of the insufficient volume footnote for polytomous items:

- If your selected analysis contains both dichotomous and polytomous items use the Item Scoring filter to review one set of results before changing the filter to view the remaining items.
- If your report includes more than one analysis or comparison, use the Analysis Filter navigation to move from one analysis to the next as you complete your review(s).
Standardized Percents Table
- The table will display the standardized percents for the Focal Group, the Reference Group, and the Difference at the response or credit (when applicable) level for each item based on your filter selections. The Assembly Unit Information and Use Code display in the same way they did in the "Item Level" report, including having a tooltip available when truncation occurs.
- The correct response(s), when applicable, will be marked with an asterisk. If an item has no response-level statistics and credit-level statistics are displayed instead.
- Insufficient volume indicator: As with the "Item Level" report, the Standardized Percent report contains a "Small N Indicator" when one or more items had insufficient volume to produce DIF statistics. See the notes above in the Item Level Table section regarding the purpose and functionality of this indicator. As with the "Item Level" report, a footnote is displayed when one or more items had insufficient volume.
- For comparisons that do include at least one item with insufficient volume:
- Items with the Small N indicator will not have any response-level statistics stored. The Response column will display only as "Null".
- While in the Standardized Percents report view, if you would like to see only the items with Small N, change the DIF Flags filter to view "(All)" and the DIF Statistics filter selection to only select "Small N Indicator". Click Apply.
- While in the Standardized Percents report view, if you would like to see all items except those with Small N, update the DIF Statistics selection and deselect "Small N Indicator". Click Apply.
- For comparisons that do include at least one item with insufficient volume:
- If your selected analysis contains both dichotomous and polytomous items use the Item Scoring filter to review one set of results before changing the filter to view the remaining items.
- If your report includes more than one analysis or comparison, use the Analysis filter navigation to move from one analysis to the next as you complete your review(s).