From the PARcore Data Visualization Studio Landing Page, navigate to this report by selecting the Criterion Frequency report icon. This report is only applicable for requests that include the Analysis Type of Item Analysis - Classical.
The bento box menu icon at the top left of the report can be used to navigate back to the Landing Page.

When first launching the report it will be empty. Make initial filter selections in order to visualize the report. Any filter with a red asterisk indicates it is required to have a selection made before the report can be displayed.
Filters
Refer to Visualize Results for general information about filter navigation for any report. The filters for this report are:
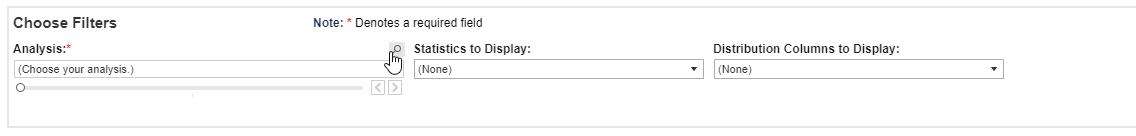
- Analysis - select one analysis sequence number to view at a time. The analysis sequence number will reflect the sequencing from Request Details for this request.
- Upon first initializing this dashboard, the filter will display as (Choose your analysis) and a selection must be made.
- Select the search icon (magnifying glass) and enter search text to see Analysis filter options for the request you are viewing. Using an asterisk in the search text box will display all possible analyses to choose from.
- Once the current analysis results have been reviewed, continue to use the search feature or utilize the slider arrows (< and >) to view each analysis one at a time. If there is only one analysis for this report the navigation buttons will be disabled.
- The criterion score for the analysis will also be included in the filter description.
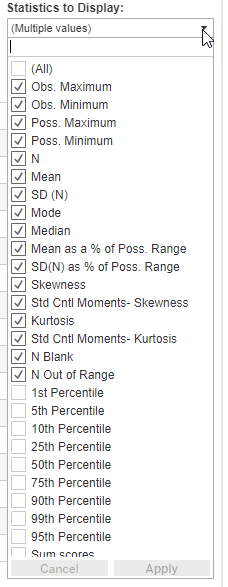
- The Statistics to Display filter has a set of default statistics pre-selected for display.
- The filter selections made will determine which statistics are displayed in the "Summary Statistics" section of the report.
- If needed, change the filter selections to modify which statistics are displayed in the "Summary Statistics" section. Only statistics stored for the analysis being viewed are available in the filter menu.
- If changing the default filter selection values, any selection changes will persist when changing the Analysis filter being viewed. If the filter was changed to display statistics that are not relevant to the next analysis a blank report may be produced with a message to adjust your filters.
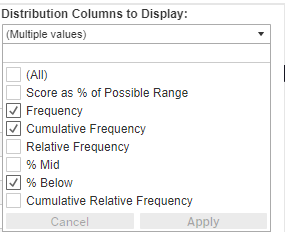
- The Distribution Columns to Display filter has a set of default statistics pre-selected for display.
- The filter selections made will determine which statistics are displayed in the "Frequency Distributions" section(s) of the report.
- If needed, change the filter selections to modify which frequency distribution statistics are displayed. Only statistics stored for the analysis being viewed are available in the filter menu.
- If changing the default filter selection values, any selection changes will persist when changing the Analysis filter being viewed.
Summary Statistics section
- The summary statistics for the criterion score and (if applicable) the equate item statistics reference will appear in a table on the left of the report screen. Adjust the "Statistics to Display" filter if needed to change the statistics being viewed.
- The reference summary statistics are only displayed if the selected analysis included an equate item statistics request.
- Depending upon the reference request used, some reference requests from GENASYS (any before February 20, 2016) or from an import statistics analysis in PARcore may not store any of the summary statistics or only store a subset of the summary statistics.
- If no summary statistics are stored then the rendered report will include only a the Criterion column of statistics and the Reference column will not display at all, even though a reference distribution was used in this analysis.
- If a subset of summary statistics are stored the Reference column of statistics will display and any statistics that were not stored will be blank.
- An ellipsis will display at the end of any statistic value that is truncated due to length. A tooltip appears when hovering over a statistic value to display the full rounded statistic value without truncation.
Frequency Distributions section(s)
- The frequency distributions for the selected analysis will appear in a table to the right of the summary statistics. Adjust the "Distribution Columns to Display" filter if needed to change the columns being viewed.
- If this analysis has both Criterion and Reference distributions, both will be displayed in separate containers.
- The reference frequency statistics are only displayed if the selected analysis included an equate item statistics request. Depending upon the reference request used:
- Reference requests coming from GENASYS or from import statistics store only the observed score range instead of the full possible score range.
- Reference requests coming from GENASYS before February 20, 2016 did not store all distributions (such as cumulative frequency, percent below, etc.). Similarly, reference requests coming from import statistics may not contain all distributions either. In this case only the distributions that have been stored and that were selected in the Distribution Columns to Display filter will be shown.
- The reference frequency statistics are only displayed if the selected analysis included an equate item statistics request. Depending upon the reference request used: