From the PARcore Data Visualization Studio Landing Page, navigate to this report by selecting the Item Histograms report icon. This report is only applicable for requests that include the Analysis Type of Item Analysis - Classical.
The bento box menu icon at the top left of the report can be used to navigate back to the Landing Page.
When first launching the report it will be empty. Make initial filter selections in order to visualize the report. Any filter with a red asterisk indicates it is required to have a selection made before the report can be displayed.
Filters
Refer to Visualize Results for general information about filter navigation for any report. The filters for this report are:

- Analysis - select one analysis sequence number to view at a time. The analysis sequence number will reflect the sequencing from Request Details for this request.
- Upon first initializing this dashboard, the filter will display as (Choose your analysis) and a selection must be made.
- Select the search icon (magnifying glass) and enter search text to see Analysis filter options for the request you are viewing. Using an asterisk in the search text box will display all possible analyses to choose from.
- Once the current analysis results have been reviewed, continue to use the search feature or utilize the slider arrows (< and >) to view each analysis one at a time. If there is only one analysis for this report the navigation buttons will be disabled.
- The criterion score for the analysis will also be included in the filter description.
- Statistic: Users can select one Statistic to view at a time
- The dropdown list contains all possible statistics that can be graphed based on the analysis selected, such as Average Item Score, PPlus, Delta, and Correlation(s) with Criterion.
- The default display is Average Item Score.
- If your selected analysis has only polytomous items, you will have to change the filter selection to PPlus before you can see your histogram.
- After viewing the histogram(s) for the selected statistic, use this filter to continue to move through each statistic to review one at a time.
- The dropdown list contains all possible statistics that can be graphed based on the analysis selected, such as Average Item Score, PPlus, Delta, and Correlation(s) with Criterion.
- Bin Size for AIS, PPlus, and all Correlations: Users can select between two options for the bin size to apply to the Y-axis statistic on the histograms for Average Item Score, PPlus, and any Correlation with Criterion.
- The two bin size options are:
- 0.05 (default selection)
- 0.10
- The histogram display will dynamically adjust if the bin size filter selection is changed to allow users to modify their bin sizes for the Y-axis as they review if needed.
- The two bin size options are:
- Bin Size for Delta: Users can select between two options for the bin size to apply to the Y-axis statistic on the histogram for Deltas.
- The two bin size options are:
- 0.50
- 1.00 (default selection)
- The histogram display will dynamically adjust if the bin size filter selection is changed to allow users to modify their bin sizes for the Y-axis as they review if needed.
- The two bin size options are:
Item Histogram Plot Display:
- When applicable, histograms for the reference statistics are displayed to the left of the observed statistics histogram.
- Only dichotomous items are included in the histograms for all statistics except PPlus.
- When applicable, PPlus will display separate histograms for dichotomous items and polytomous items.
- If your selected analysis contains only polytomous items then you can only view the PPlus histograms for this analysis.
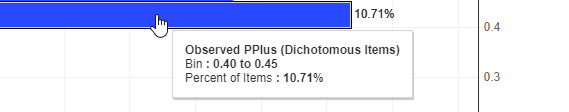
- A tooltip is available when hovering over a histogram bar to identify the binned statistic values and the percent of items within that bin.
- Summary statistics are displayed beneath the histograms.