From the PARcore Data Visualization Studio Landing Page, navigate to this report by selecting the Item Response Curves report icon. This report is only applicable for requests that include the Analysis Type of Item Analysis - Classical and users chose to produce empirical item response curves.
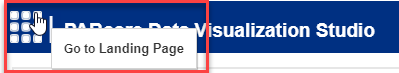
The bento box menu icon at the top left of the report can be used to navigate back to the Landing Page.
When first launching the report it will be empty. Make initial filter selections in order to visualize the report. Any filter with a red asterisk indicates it is required to have a selection made before the report can be displayed.
Filters
Refer to Visualize Results for general information about filter navigation for any report. All filters will persist as you move to other items or other analyses. It is best practice to reset all filters back to the desired selections when changing analyses or (if needed) when changing the item being viewed. If any part of the report is not being visualized, please recheck all filter selections are as intended. The filters for this report are:

- Analysis - select one analysis sequence number to view at a time. The analysis sequence number will reflect the sequencing from Request Details for this request.
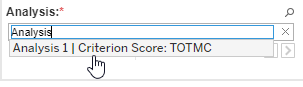
- Upon first initializing this dashboard, the filter will display as (Choose your analysis) and a selection must be made.
- Select the search icon (magnifying glass) and enter search text to see Analysis filter options for the request you are viewing. Using an asterisk in the search text box will display all possible analyses to choose from.
- Once the current analysis results have been reviewed, continue to use the search feature or utilize the slider arrows (< and >) to view each analysis one at a time. If there is only one analysis for this report the navigation buttons will be disabled.
- The criterion score for the analysis will also be included in the filter description.
- Item Flags: This is a multi-select filter and allows users to select which items to display based on which flag(s) the item has.
- Upon first initializing this dashboard, the filter will display as (None) but should become populated once an Analysis filter selection is made.
- Default filter selection: (All)
- Only flags that are present in the data for the analysis selected in the previous filter will be included in the dropdown menu.
- Selecting the blank entry will show items with no flags.
- The dropdown list contains all possible combinations of flags seen in the data for the selected analysis.
- For example, if an item received both a D and S flag, there will be a dropdown menu entry to select "D S". Selecting that entry will show only items that have both a D and S flag and no other flags.
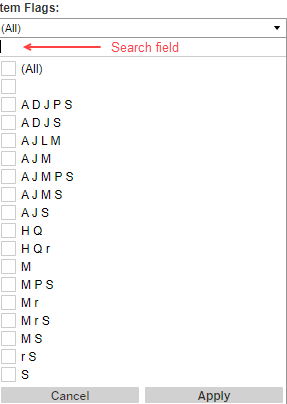
- If there are six or more flag combinations listed in the dropdown list a search feature will also be in place for users to search among the dropdown options for the combinations that they would like to view.
- To utilize the search feature to select to see only items with one specific designation (such as "A"):
- Deselect the default "(All)" selection so that no entries have a check mark.
- In the Search box, type the letter designation you would like to see (case insensitive). All combinations with that letter included will be displayed. Select the ones you want to view, or select all of them to see all items with that letter designation. Choose the Apply button.
- To utilize the search feature to select to see only items with two or more specific letter designations (such as all "r" and "A" flags):
- Deselect the default "(All)" selection so that no entries have a check mark.
- In the Search box, type the first letter designation you would like to see. All combinations with that letter included will be displayed. Select the ones you want to include. Do not choose Apply yet.
- After you select the ones you want with the first flag letter, clear the filter by selecting the X icon to clear your filter search results. The selections you made previously will be kept.
- In the now empty Search box type the next letter designation you would like to see. All combinations with that letter included will be displayed. Select the ones you want to view.
- Continue these steps (clearing the filter, searching all combinations of a letter) until you have selected every flag letter designation you want to view.
- Select Apply. Your report will now be filtered by all of the letter designation combinations you selected.
- To utilize the search feature to select to see only items with one specific designation (such as "A"):
- Any filter change made here will persist if moving to a different analysis. Clear the filter before moving to your next analysis, otherwise your rendered results may not be as expected.
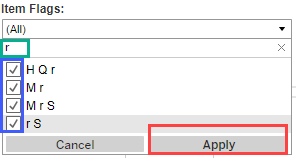
Example - search for all items with an "r" designation
Step 1 - Deselect all flags
Step 2 - Enter "r" in the search field to see a list of only flags that include an "r" designation. Select each of them. Select Apply.
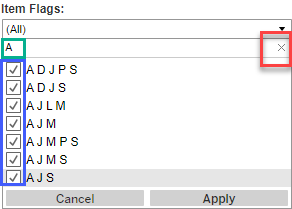
Example - choosing all items with an "A" or a "M" designation
Step 1 - Deselect all flags
Step 2 - Search for "A"; select all filtered flags; select clear (X) to search another letter designation
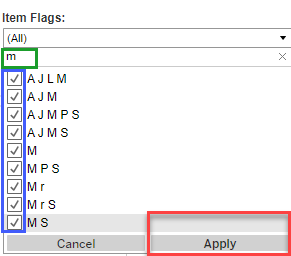
Step 3 - Search for "M"; select all filtered flags; select Apply
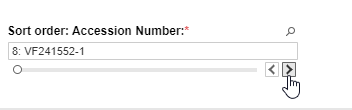
- Sort Order: Accession Number: Users can select the item response curve to display, one item at a time, by selecting a specific accession number.
- Upon first initializing this dashboard, the filter will display as (Choose your accession number) and a selection must be made.
- Select the search icon (magnifying glass) and enter search text to see all accession numbers for the analysis you are viewing.
- Using an asterisk in the search text box will display all possible analyses to choose from.
- If you want to view a specific accession number, enter the accession number into the search text field.
- The format of the displayed items is first by a sort order value, then a colon, then the accession number, a dash, then scoring version for that item.
- The sort order value is only meaningful in the data visualization tool and is used to ensure the accession numbers are being displayed in the preferred sort order, which is:
- MST tests: items are listed by ascending alphabetical assembly unit, then ascending sequence within each assembly unit.
- PBT or IBT tests: items are listed by ascending delivery order of the assembly unit, then ascending sequence within each assembly unit.
- If in your Item Analysis - Classical Analysis processing options, for Combined Item Responses the selection is 'Use Response for Accession # Within Specific Form/AU' then the Assembly Unit ID is also included in the filter details after the scoring version number to better allow users to distinguish the item and assembly unit to select.
- The sort order value is only meaningful in the data visualization tool and is used to ensure the accession numbers are being displayed in the preferred sort order, which is:
- If an item has more than one scoring version there will be separate entries and therefore separate item statistics and graphs for each scoring version.
- Only accession numbers that appear in the analysis selected and with the item flags selected in the Item Flags filter will appear in this list.
- Once the current item has been reviewed, continue to use the search feature or utilize the slider arrows (< and >) to view each item one at a time.
- When moving to another analysis or if having change the item flag filter, you may need to make the accession number selection again before a report is displayed.
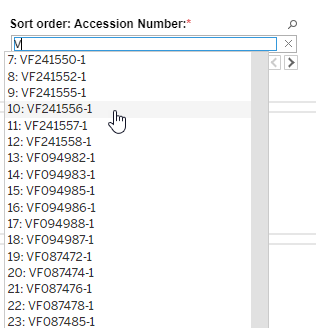
Navigate using the slider to move to the next item
- Response Type: Users can select what type of responses to display in their response curves. This is a single select filter and only one response type can be viewed at a time.
- Only response type options relevant to the item being viewed will be listed in the dropdown menu. Most items will allow the user to display either response-level curves (by selecting RESPONSE) or credit-level curves (by selecting CREDIT). Change the filter selection as desired.
- Some item types have only CREDIT level statistics and curves (such as Essay items). If an item does not have "RESPONSE" level curves or statistics, the user will need to make a filter selection that is valid before the curves can be visualized.
- Composite part items doe not contain CREDIT level statistics or curves and will not have this option available.
- The default display is "RESPONSE".
- Any changes to the filter will persist as you move to view other items.
- Only response type options relevant to the item being viewed will be listed in the dropdown menu. Most items will allow the user to display either response-level curves (by selecting RESPONSE) or credit-level curves (by selecting CREDIT). Change the filter selection as desired.
- Report Type: Users can select to view either the All Test Takers report or the High Ability report (if applicable) for this item. The default display is "All Test Takers".
Item-Level Statistics Section:
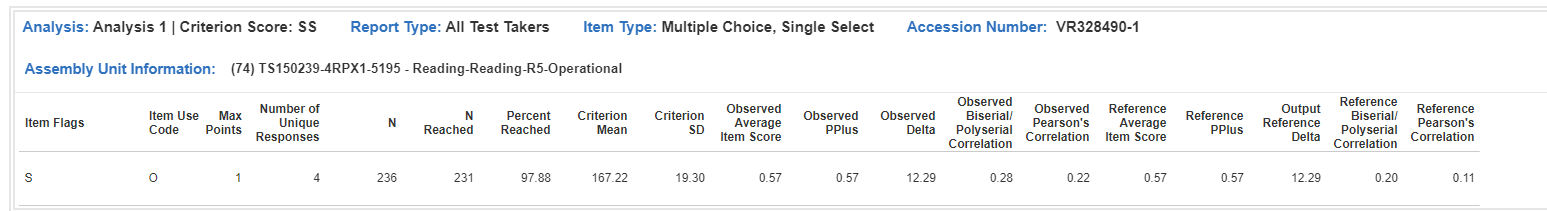
- The top section of this report will display any item-level statistics relevant to the item being viewed. The Item Flags and Item Type, as well as the sequence and assembly unit information are also displayed in this section. The assembly unit information is a concatenation of the assembly unit ID, assembly unit name, test measure, test measure type, and research usage type for that item.
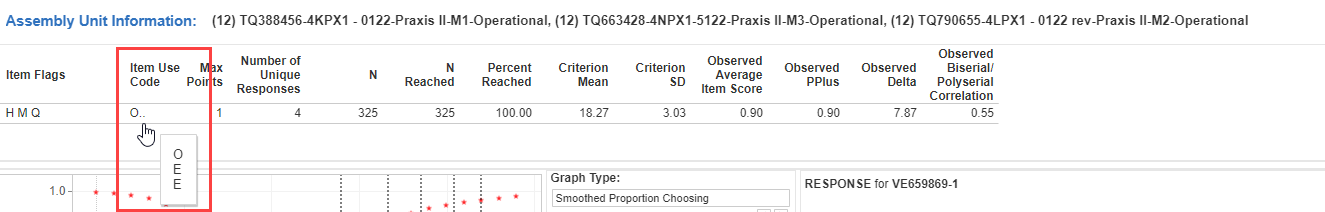
- When hovering over the assembly unit information a tooltip will appear that also displays the information. This tooltip is useful in cases where your assembly unit details are too long for the space allocated and become truncated. In those cases, the tooltip display of the assembly unit information will display the full details without truncation.
- If an item has multiple assembly units it may also have different item use codes for each assembly unit. In this case, only the item use code for the first assembly unit is displayed, but when hovering over the value a tooltip will appear to show each item use code. They are presented in order based on the order the assembly units display in the Assembly Unit Information field above. This tooltip only presents in cases with multiple assembly units.
Graphs Section:
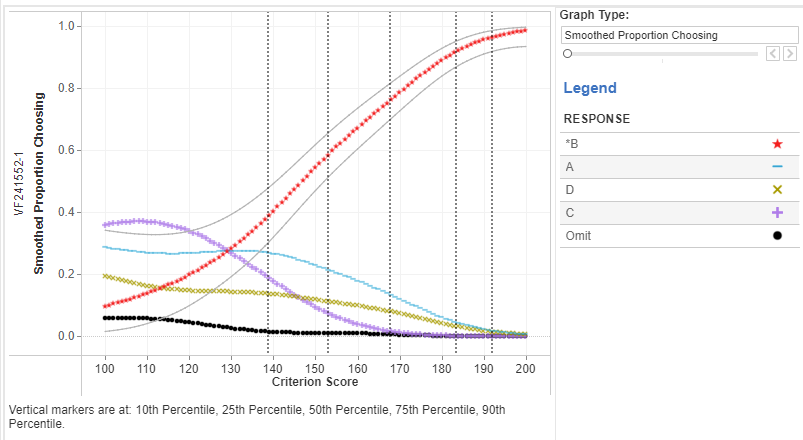
An Item Response Curve is displayed based on the specific filter selections.
- The Y-axis is Smoothed Proportion Choosing by default for all items. Only partial credit items can have other Y-axis values. See details below related to Graph Type filter for more information.
- The X-axis is the Criterion Score (possible score range). The axis is the same for both All Test Taker reports and High Ability reports.
- Vertical Markers will be displayed at the 10th, 25th, 50th, 75th, and 90th percentiles.
- Each plot line will be a different color and shape combination.
- A grey confidence band will be displayed around the correct response when applicable based on the request details confidence shading option.
- A tooltip appears if you hover over or click on any plot point and contains the Response, Y-axis value, and X-axis value for the selected data point.
- If desired, utilize the zoom feature to change the focus of the plot to get a closer view of a specific range of data points. Refer to Visualize Results for general information about the zoom functionality for any report that contains plots.
To the right of the response curve will be the following information:
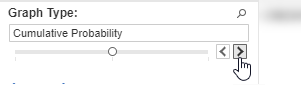
- “Graph Type” slider filter will display the Smoothed Proportion Choosing graph by default.
- The slider filter navigation buttons (< and >) will be disabled if Smoothed Proportion Choosing is the only graph option for this item.
- When viewing a partial credit item if your request details included additional partial credit plots (Cumulative Probability and/or Expected Item Score), those can be viewed by changing your Response Type to “CREDIT” and then changing the “Graph Type” filter to the desired additional graph.
- Change your Graph Type back to Smoothed Proportion Choosing when changing the accession filter back to an accession number that does not contain partial credit graphs.
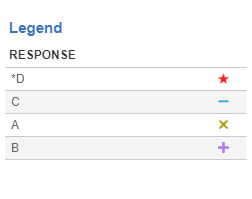
- A legend for the Item Response Curves displays the color and shape of each response line plotted. The correct response is identified by an asterisk unless the item being viewed is a composite part item.
- If you want to highlight a specific response in the plots, you can select that response in the legend to highlight it. Select the response again to deselect the highlight.
Response/Credit Level Statistics Section:
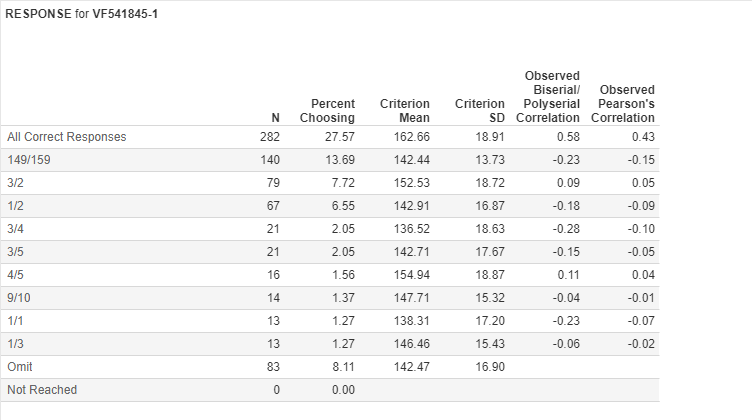
- Response-level or credit-level item statistics are displayed based on the specific filter selections.
- When viewing response-level statistics:
- The correct response, when applicable, will be marked with an asterisk. If an item has more than one correct response, only the aggregate correct response (All Correct Responses, All Full or Partial Credit Responses) is displayed.
- When viewing the All Test Taker report, the high ability group statistics (if applicable) are only displayed when an item is Multiple Choice, Single Select or when the Response Type filter selection is “CREDIT”.
- To view the high ability group statistics and graphs (if applicable for this request) for the item being viewed, change the Report Type to “High Ability”.
Item Comments
- You are able to view item comments or add new comments for a particular item directly in the Data Visualization Studio.
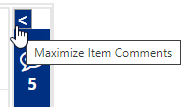
- By default, the item comments pane is open but minimized. The number of existing item comments for the item being viewed is visible in the minimized pane.
- To open (maximize) the pane to see the comments, click on the maximize item comments chevron.
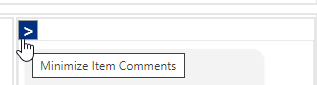
- To minimize the pane again to close the comments but keep the comment count visible, click on the minimize item comments chevron at the top of the pane.
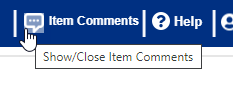
- To fully close the pane entirely the "Show/Close Item Comments" icon in the banner of the report can be selected. Select it again to open the comments back up if desired.
Maximizing Item Comment Pane
Minimizing Item Comment Pane
Full Close or Open of Item Comment Pane
- You can only see comments for the item you are currently viewing.
- All comments are displayed with the date-time-stamp for when the comment was created and the author of the comment. Automatically generated comments are authored by "PARSTAT".
- Comments are listed from oldest to newest based on the date-time stamp.
Auto-generated Item Comments
- Any item with an Item Flag will have automatically generated comments produced that describe why the flag(s) were triggered, with specific information relevant to the item. The automatically generated comments should provide sufficient details to reduce the amount of manual comments that will need to be entered.
- Autogenerated comments cannot be edited or deleted within the Data Visualization Studio.
- Composite part items:
- Although there are separate graphs for each composite and part that display individually in the Data Visualization Studio, all composite and part comments are viewed together. This is true of how the comments are displayed in the IBIS application as well. When viewing a part item or the full composite you will therefore see the same collection of comments, which are the combined comments across all parts and the whole item.
- If an auto-generated comment is specific to one of the part items it will detail that directly in the PARSTAT comment (e.g. "Part A: The sample size of 239.0 is less than the threshold of 300.0). If there is no specific reference to a part in the auto-generated comment then it is referencing the full composite item flags and statistics.
- If viewing comments in the IBIS® Application be aware that the item and the comments are viewed at the item level and never by the parts.
Entering Manual Comments:
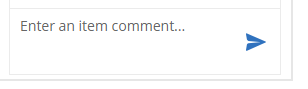
- To add a new item comment, enter your comment in the text field.
- Comments can only be 1024 characters long.
- If a comment exceeds this limit, a warning message will appear to indicate that the comment must be edited to 1024 characters or less before it can be submitted. Exit out of the message and edit the comment further before submitting it.
- If an error occurs when trying to enter a comment an error message will be displayed "An unexpected error occurred. Close this error and try again after some time."
- Close the error message and try again later. If this issue persists contact PAR S&C staff.
- Click on the send icon once you are ready to submit and store the comment.
- Comments can only be 1024 characters long.
- The new comment will display right-aligned and in a blue bubble while actively viewing this item. Once the session is over or a new item is viewed, the entered comment will become left aligned and gray.
- You may enter more comments as needed.
- Manual comments can be entered either before or after the request is approved. The manual comments entered will be stored and viewable in the Data Visualization Studio any time the request is opened again, unless the comment is deleted by the user at some point.
- Composite part items:
- Although there are separate graphs for each composite and part that display individually in the Data Visualization Studio, all composite and part comments are viewed together. This is true of how the comments are displayed in the IBIS application as well. When viewing a part item or the full composite you will therefore see the same collection of comments, which are the combined comments across all parts and the whole item.
- You can enter a manual comment while viewing a specific part or when viewing the full composite item. Because they are all stored and displayed together, please be specific about whether the comment is related to the graph/stats for a specific part or for the composite whole. For example "Part A: distractor B appears to perform similar to the key response."
- If viewing comments in the IBIS® Application be aware that the item and the comments are viewed at the item level and never by the parts.
Deleting a comment
- A trashcan delete icon will appear for any comment where deleting is enabled. Click on the icon to delete the comment.
- Users can only delete comments that they authored and where the request status is Run Warning or Run Complete.
- Auto-generated comments cannot be deleted.
- Comments cannot be deleted within the Data Visualization Studio once a request status is Approved. New comments can be added after a request is approved, but those cannot be deleted either.
Comment flow to the IBIS Application:
- Once the request has been approved, the item comments will be saved in the IBIS application to view in the Launch Item Analysis UI in the Comments section and in the Item Object page in the Comments section, along with the context information from the PARcore request (Program, Test, Admin, Form, Accession Number).
- Tagging Criteria to flow to Launch Item Analysis module in the IBIS Application:
- Item Comments tagged as PIA will be visible in the PIA category
- Item Comments tagged as FIA will be visible in the FIA category
- Item Comments that are not tagged as PIA or FIA will not be visible in Launch Item Analysis and will only be visible within the Item Comments in the statistics Category with no subcategory value
- Comments are also stored as retrievable statistics via an SRR.
- The comments which were saved and sent from PARcore will not be editable in the IBIS application, but users can add additional comments in the IBIS application if desired. Any comments added there will NOT be sent back to PARcore.
Troubleshooting Item Response Curves
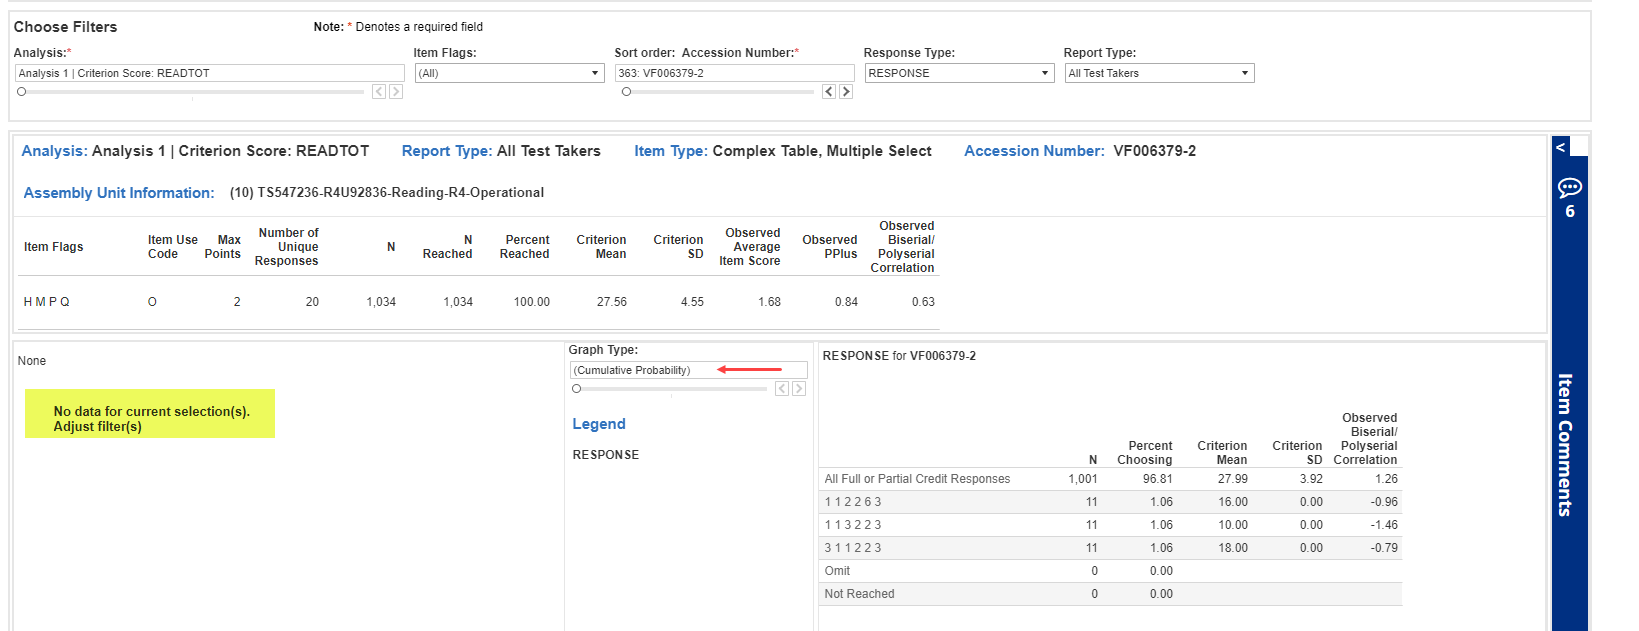
Due to the complexity of the filters and views, there can be some common scenarios that result in only partial data being displayed. These issues can be corrected by reviewing the filter selections and changing any filters with invalid selections. Invalid filter entries are generally shown with parentheses around them to highlight to the user that the filter selection is not valid. Some common occurrences may be:
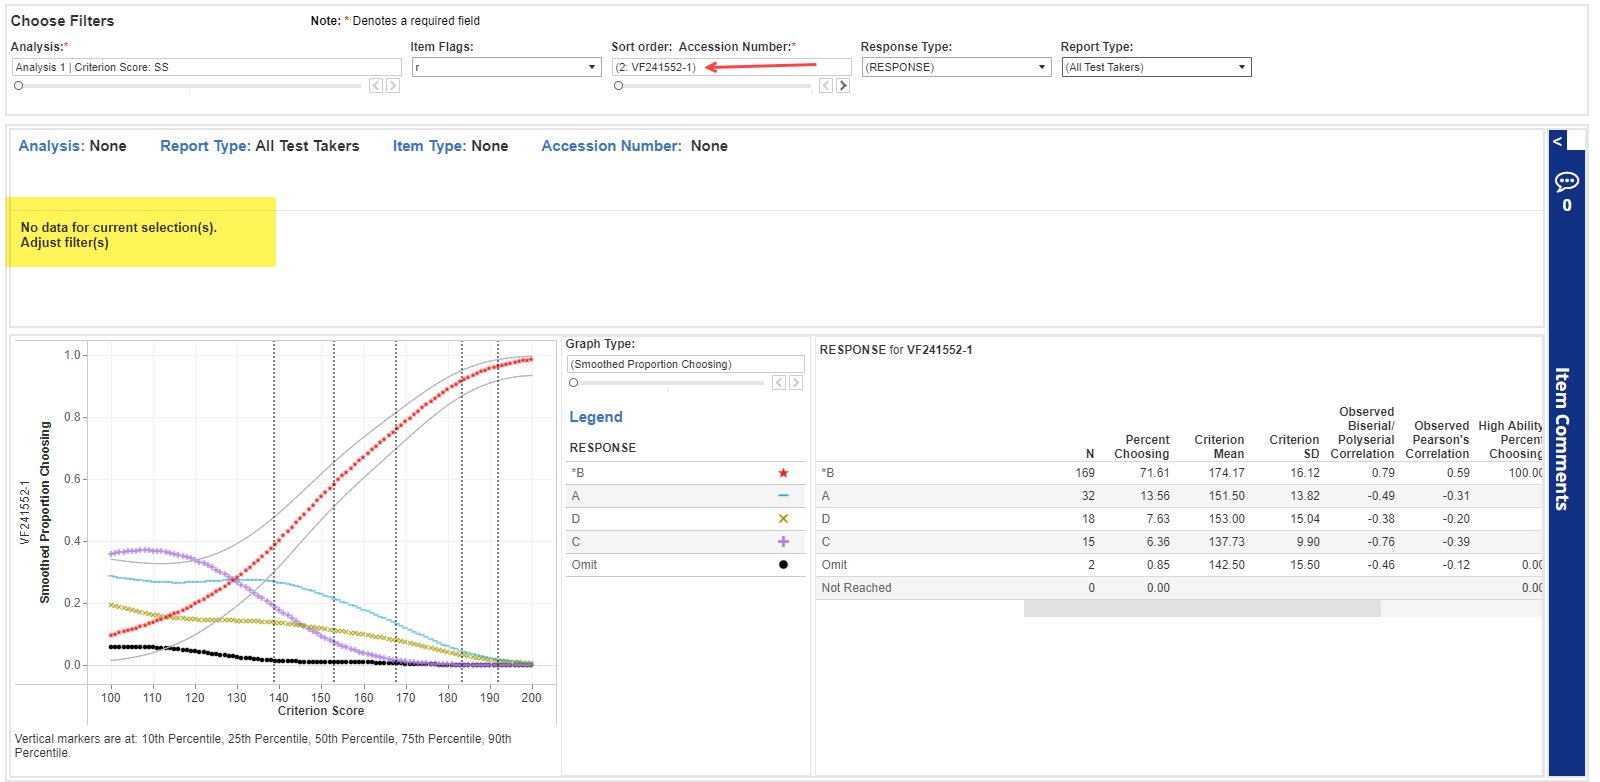
- Changing the Item Flags or Analysis filter after viewing an item: If you change the Item Flags filter or Analysis filter to a selection that is not relevant to the item being displayed, you will see partial data. The graphs and response level statistics for your previous view are still displayed, but the item-level statistics are now missing. Change your Sort Order: Accession Number filter selection to a valid entry to fix this issue.
Example where the item being viewed is no longer valid and results in partial data displayed:
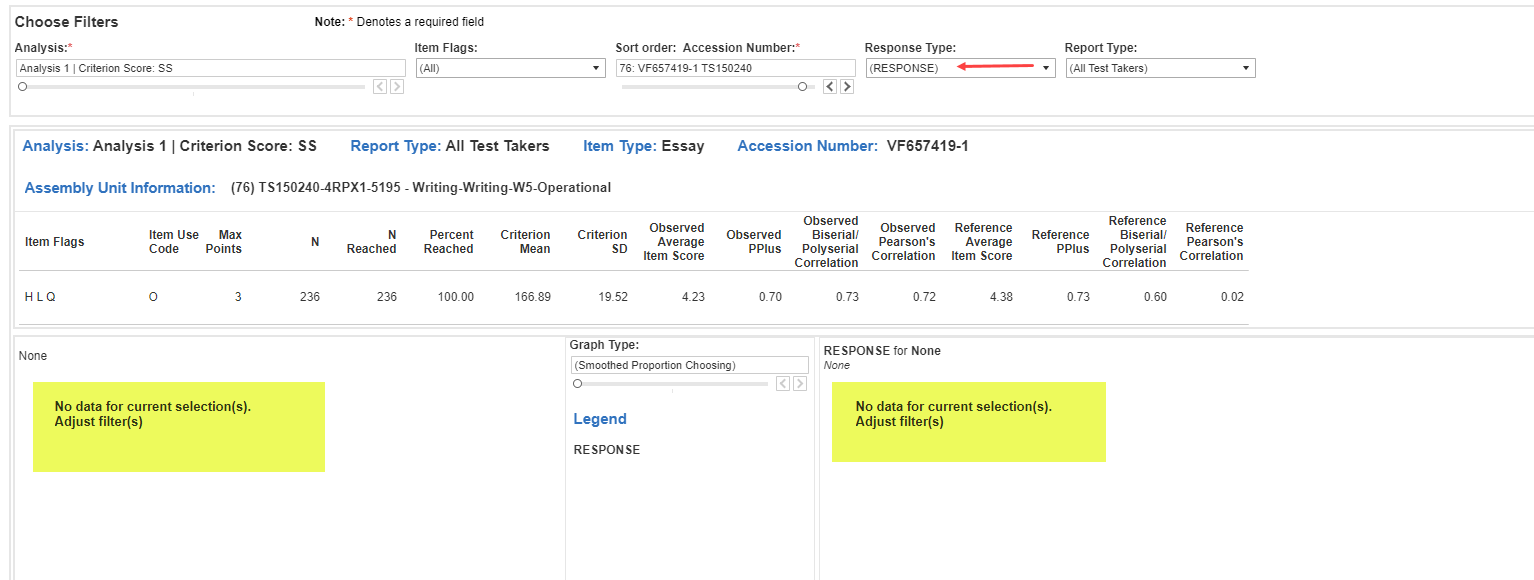
- Moving to an item with only CREDIT or only RESPONSE level statistics: If you move from an item where the RESPONSE level statistics were being viewed to an item that has only credit-level statistics (such as an Essay item), the item level statistics will display but the graph and response level statistics will not render. This can also happen when moving from an item in the CREDIT view to an item without credit level statistics (such as a composite part item). Change your Response Type filter selection to a valid selection to fix this display issue.
Example where the item being viewed has no response-level statistics:
- Moving from a partial credit graph display to an item that is not partial credit: If you are viewing an additional partial credit plot (such as Cumulative Probability or Expected Item Score) to an item without that graphs the graph data will not render. This can also happen when moving from a partial credit plot back to the Response Type filter for RESPONSE. Change the Graph Type filter selection to a valid selection to fix this display issue.
Example when moving away from an item with partial credit plots: