From the PARcore Data Visualization Studio Landing Page, navigate to this report by selecting the Frequency and Summary Statistics report icon. This report is only applicable for requests that include the Analysis Type of Summary Statistics and the selection of Yes to at least one of the following analysis options: Frequency Distributions and Summary Statistics, Category-Counts, Category-Scores Frequency Distribution and Summary Statistics, and Bivariate Frequency Distributions.
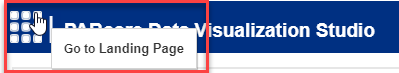
The bento box menu icon at the top left of the report can be used to navigate back to the Landing Page.
When first launching the report it will be empty. Make initial filter selections in order to visualize the report. Any filter with a red asterisk indicates it is required to have a selection made before the report can be displayed.
Filters
Refer to Visualize Results for general information about filter navigation for any report. The filters for this report are:
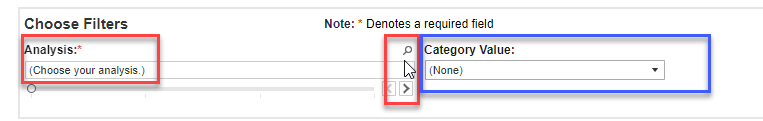
- Analysis - select one analysis sequence number to view at a time. The analysis sequence number will reflect the sequencing from Request Details for this request.
- Upon first initializing this dashboard, the filter will display as (Choose your analysis) and a selection must be made.
- Select the search icon (magnifying glass) and enter search text to see Analysis filter options for the request you are viewing. Using an asterisk in the search text box will display all possible analyses to choose from.
- Once the current analysis results have been reviewed, continue to use the search feature or utilize the slider arrows (< and >) to view each analysis one at a time. These navigation buttons are only enabled when there is more than one analysis to view.
- When viewing a Summary Statistics analysis for Frequency Distributions and Summary Statistics or Bivariate Frequency Distributions, the score being analyzed will also be included in the filter description.
- When viewing a Summary Statistics analysis for Category-Scores Frequency Distributions and Summary Statistics, the score and category being analyzed are included in the filter description.
- When viewing a Summary Statistics analysis for Category-Counts, the category being analyzed will be included in the filter description.
- Category Value
- Once an Analysis filter selection is made, the Category Value filter should become populated.
- If viewing a Frequency Distribution and Summary Statistics analysis or a Bivariate Frequency Distributions analysis the value in the filter should display as (No Category Value)
- If viewing a Category-Counts or Category-Scores Frequency Distribution and Summary Statistics analysis all relevant category values should be selected by default. Users can modify which category values to view using this filter and selecting Apply.
- The selections made in this filter will determine which category values and their accompanying statistics will be displayed in the reports below.
- After changing the filter value, the filter selections will persist as you move to other analyses. If the filter selections made do not apply to the next analysis it may result in a blank report with a message displayed to adjust filters. Reselect a new filter value that is applicable to the analysis being viewed if this occurs.
- Once an Analysis filter selection is made, the Category Value filter should become populated.
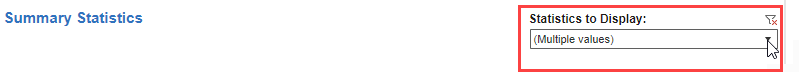
Summary Statistics section
The summary statistics for the selected analysis will appear in a table on the left of the report screen.
- The Statistics to Display filter has a set of default statistics pre-selected for display. If needed, change the filter selections to modify which statistics are displayed in this section of the report. Only statistics stored for the analysis being viewed are available in the filter menu.
- If changing the default filter selection values, any selection changes will persist when changing the Analysis filter being viewed. If the filter was changed to display statistics that are not relevant to the next analysis a blank report may be produced with a message to adjust your filters.
- An ellipsis will display at the end of any statistic value that is truncated due to length. A tooltip appears when hovering over a statistic value to display the full rounded statistic value without truncation.
- If the analysis being viewed has a category being analyzed, each category value selected in the Category Value filter will have statistics displayed.
Frequency Distributions section
The frequency distributions for the selected analysis will appear in a table on the right of the report.
- If viewing a Category-Counts analysis, the frequency distribution section is not applicable and will be blank with message indicating that there is no data for the current selection(s) and to adjust the filters. This type of analysis does not produce frequency distributions and only the Summary Statistics section will be populated until a new analysis is selected that is not Category-Counts.
- The Distribution Columns to Display filter has a set of default statistics pre-selected for display. If needed, change the filter selections to modify which statistics are displayed in this section of the report. Only statistics stored for the analysis being viewed are available in the filter menu.
- If changing the default filter selection values, any selection changes will persist when changing the Analysis filter being viewed.
- When viewing a Category-Counts analysis this table is not applicable and the filter option will display (None).
